21 Mobile app testing statistics for your next presentation
Do you face a challenge in making your mobile app unique among thousands? It's not enough to just make an interesting and credible app - it's the user experience that holds the center stage. Mobile app testing ups your game and ensures that downloading your app is just the beginning of an enjoyable ride for users.
It sounds clichéd but testing will help locate and neutralize probable app problems before actual users do. By staying informed with the latest mobile app testing statistics and implementing best practices, you'll position yourself among the top contenders in the app market.
We can help you drive global growth, better accessibility and better product quality at every level.
Importance of mobile app testing
Mobile app testing validates Android or iOS apps' functionality and usability before their public release. It ensures that the app meets the expected technical and business requirements.
Essential components of mobile app testing encompass:
- Performance evaluation across diverse OS versions.
- Assessment of appearance in both Portrait and Landscape modes.
- Validation of compatibility and performance under specific settings.
- Testing compatibility with mobile sensors such as Gyroscope, Accelerometer, and GPS.
- Examination of GUI functionality, including menus, dropdowns, and navigation buttons.
21 Key statistics that underscore the significance of mobile app testing
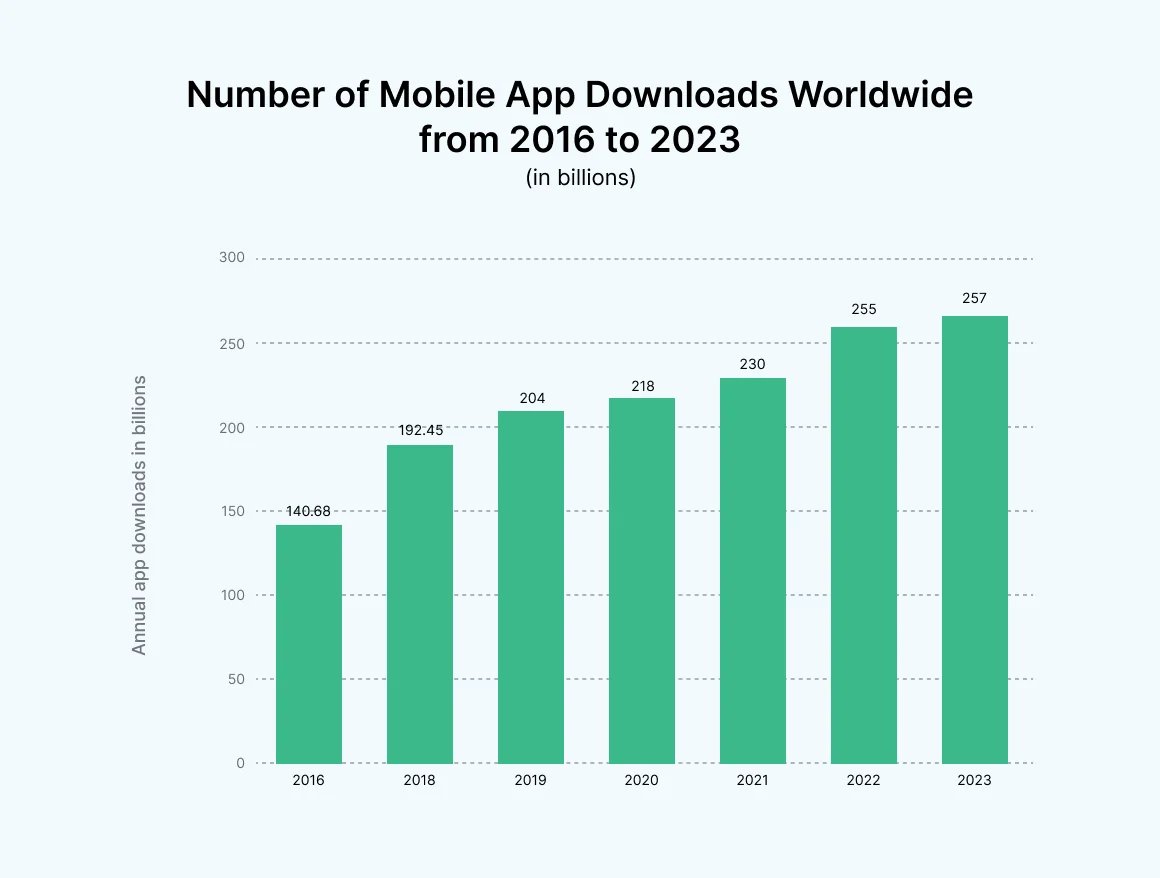
1. According to Statista, between 2016 and 2022, app downloads steadily increased. However, in 2023, global app downloads plateaued at 257 billion, with only a one percent year-over-year rise. Still, the app market is projected to surpass 613 billion U.S. dollars in revenue by 2025.
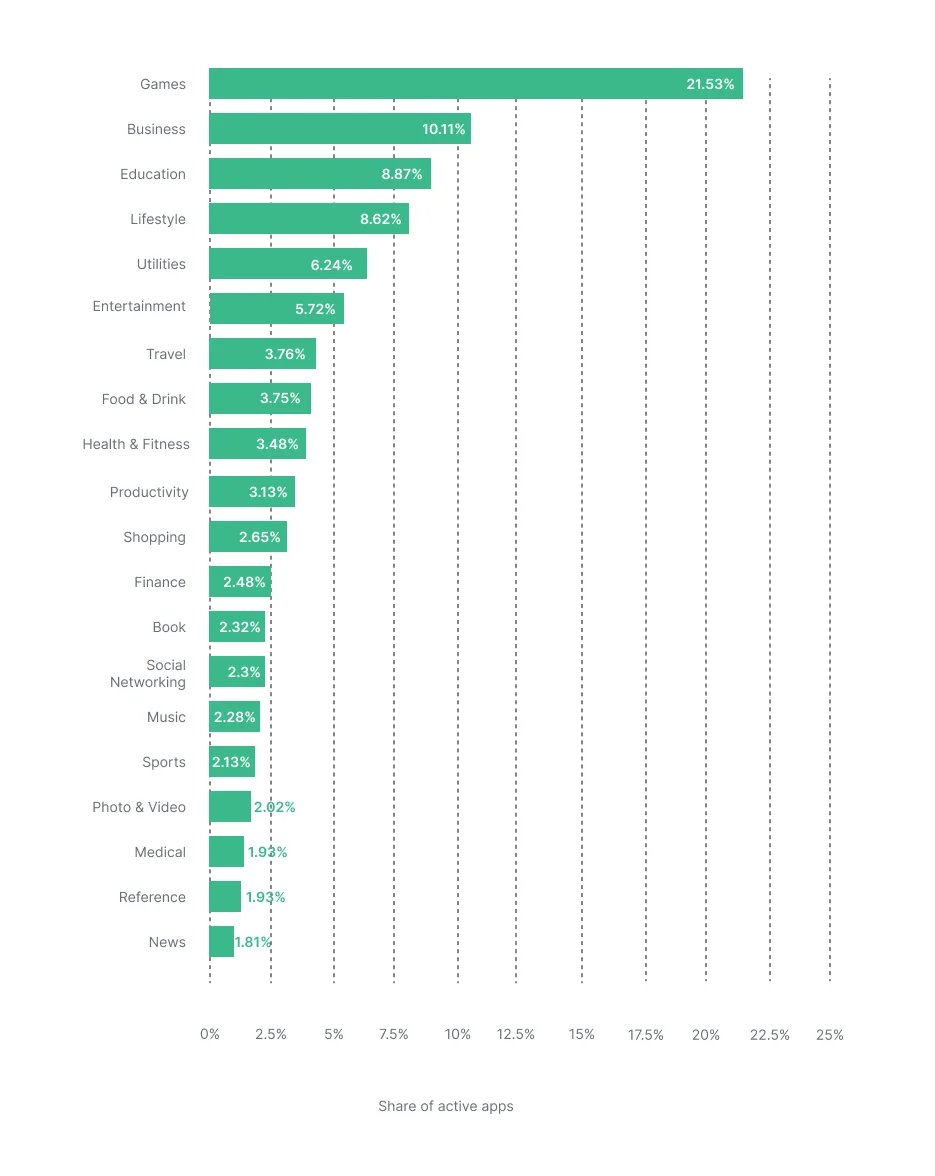
2. Mobile games dominate revenue, with gaming and video being the top mobile content categories in 2020. Despite increased app usage due to the COVID-19 pandemic, the ePublishing and education sectors still have limited market presence.
3. Mobile gaming companies face the challenge of costly customer churn, which occurs when users stop playing or uninstall a game. This results in significant financial losses, estimated at $1.6 trillion annually for businesses.
4. According to Liftoff's 2020 Mobile Gaming Apps Report, the average cost to acquire a user has decreased by 66% to $1.47 per user, compared to $4.37 in the previous year.
The cost to register a user in a game has also decreased, from $9.17 to $5.72 on average per user. However, the cost to convert a user to a paying customer has increased to $43.88 on average per user, up from $35.42 last year and $28.05 the year before.
Breaking it down, acquiring an Android user is much cheaper at $0.89, while iOS users are more expensive at $3.09. Despite this difference, both platforms show similar returns on investment, with a 30-day return on ad spend (ROAS) of 36% for Android and 37% for iOS, according to the report.
5. One of the primary reasons for user churn is technical failure, which compromises the intended experience:
- 79% of users will give an app only one or two more attempts if it fails initially.
- 70% of users will abandon an app due to prolonged loading times.
- 71% of app uninstalls occur due to crashes.
- Even a brief freeze lasting just five seconds can prompt 18% of users to immediately delete the app.
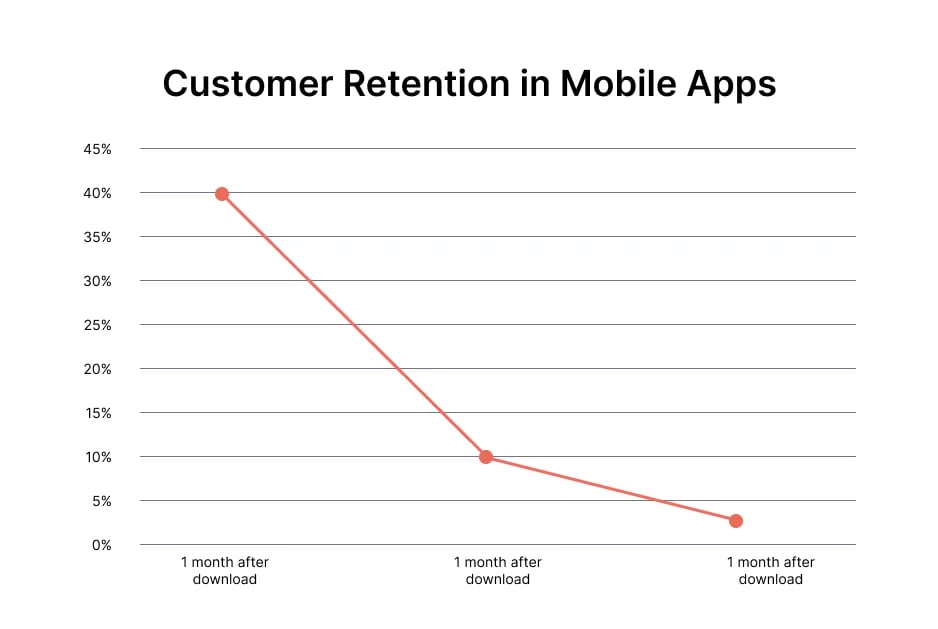
Hence, both design and technical issues contribute significantly to churn. However, technical issues, in particular, are often overlooked and require greater prioritization from mobile game teams.
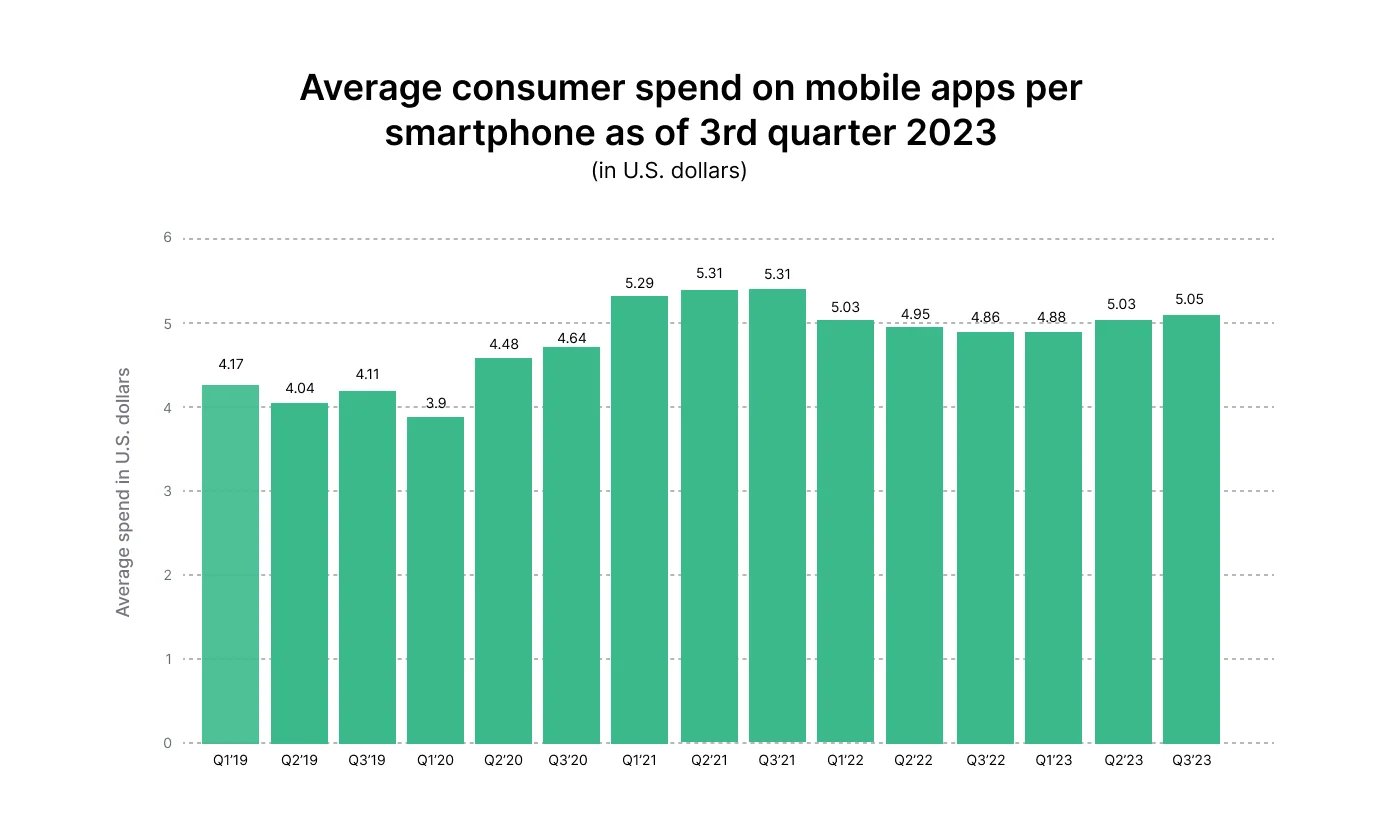
6. While most apps in major stores remain free, consumer spending on premium services and paid content is growing. In Q2 2021, Android users spent an average of 5.31 U.S. dollars per device, down from a peak of 10.6 U.S. dollars in Q4 2020.
7. Paid apps now make up only 6 percent and 4 percent of total apps in the Apple App Store and Google Play Store, respectively. Subscription-based apps are gaining popularity, with leading subscription apps generating over 10 million U.S. dollars in global revenues in 2020.
6d8b.jpg)
8. Trending Google Play app categories by downloads from March 2023 to February 2024 are the following – News and Magazines lead the pack with a 74.1% increase in monthly downloads, followed by Weather (25.03%), Entertainment (15.62%), Parenting (13.21%), and Music and Audio (12.76%).
9. The average person checks their phone 47 times a day. 44 percent of people said they would experience high levels of anxiety if they lost their phone and couldn't replace it for a week.
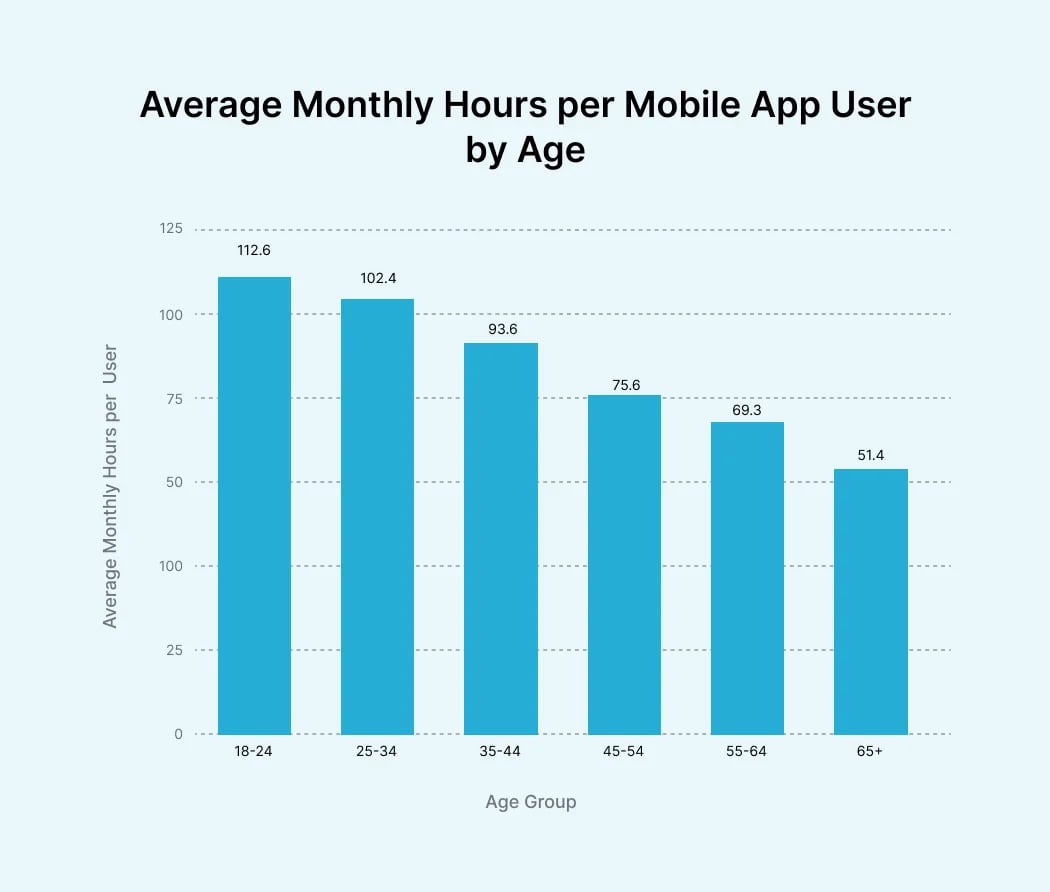
For an app to be used as frequently as it is, it must be flawless. It's imperative that every time a user accesses the app, it meets their expectations without fail. Exhaustive app testing remains the sole method to ensure such consistency.
10. According to a recent report by Future Market Insights, the global market value of mobile application testing solutions is projected to reach US$ 6.77 billion by 2024. This growth is anticipated to persist owing to ongoing advancements in mobile application technologies.
The market is forecasted to experience significant growth, with a remarkable compound annual growth rate (CAGR) of 16.8% during the forecast period. By 2034, it's estimated that the global industry share of mobile application testing solutions will approach nearly US$ 31.99 billion.
11. 73% of organizations have embraced test automation for their applications, signaling a significant shift towards innovative automated solutions over traditional manual testing methods. As the popularity of test automation continues to soar, organizations leveraging these methodologies gain a crucial competitive edge.
12. The same source states that a significant portion of engineers – 42% to be exact – encounter the turbulent waters of navigation issues as a predominant challenge while using automation.
13. According to Business Research Insights, the global Software Testing Market is forecasted to grow at an impressive compound annual growth rate (CAGR) of 21.71% from USD 284155.08 million in 2021 to reach new heights by 2027.
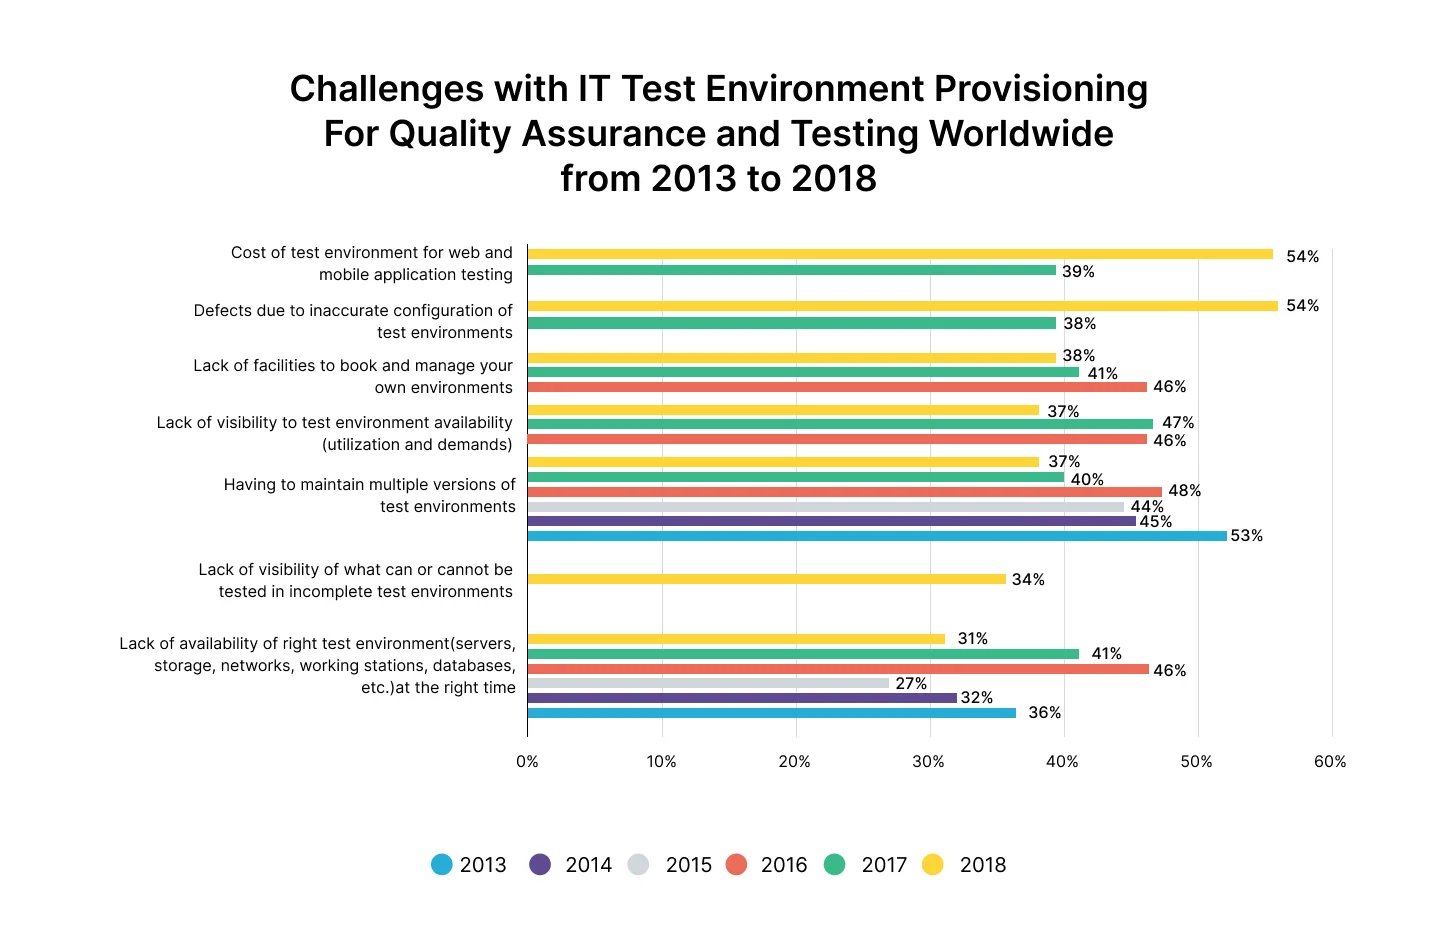
14. According to a global survey of IT executives conducted from 2013 to 2018, the most significant challenge for organizations looking to implement a test environment is cost, with 54 percent of respondents highlighting this issue in 2018.
15. 42% of organizations have reported that security incidents were triggered by vulnerabilities in mobile devices and web applications.
16. From a study encompassing over 1.3 million Android and iOS apps, it was found that 14% of apps utilizing public cloud backends had misconfigurations, leading to the exposure of users’ personal information. Additionally, in 2021, 30% of the known zero-day vulnerabilities were aimed at mobile devices. During the same period, there was a 466% surge in exploited zero-day vulnerabilities employed in active attacks against mobile endpoints. Moreover, 75% of analyzed phishing sites were specifically tailored to target mobile devices.
17. The prevalent forms of malicious network traffic originating from devices are as follows:
- Phishing messages intended to pilfer credentials (52%)
- Command and control traffic from malware residing on a device (25%)
- Accessing infected websites or URLs through browsing (23%)
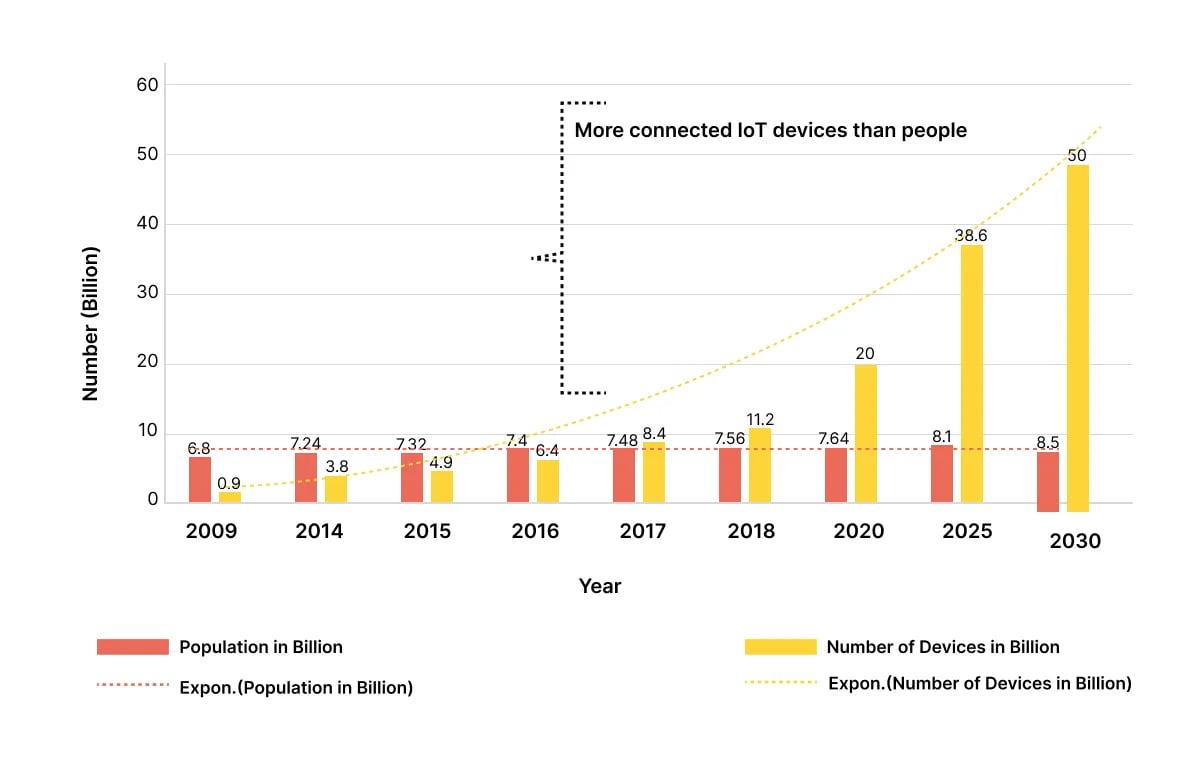
18. By 2025, the internet will see approximately 152,000 IoT devices connecting every minute.
19. As mobile apps replace websites for tasks like online banking and social networking, mobile malware rates rise. With millions of apps available, users unknowingly expose themselves to threats. Malicious apps mimic legitimate ones, blurring safety lines.
The most common mobile malware types are:
- Viruses: Spread and damage files and systems.
- Worms: Rapidly replicate across networks and devices.
- Trojans: Disguised as legitimate apps for malicious activities.
- Adware: Displays intrusive ads and redirects to unwanted sites.
- Spyware: Stealthily gathers sensitive data without user consent.
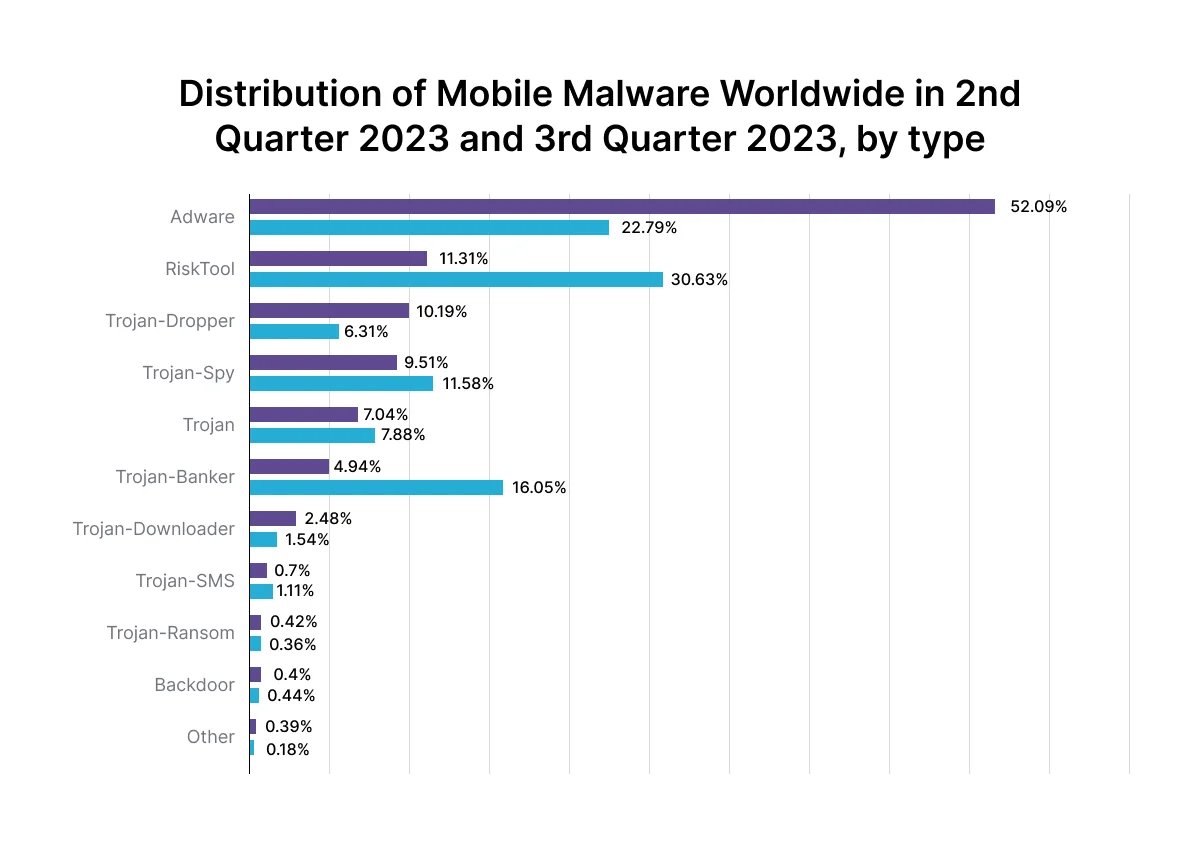
In the second quarter of 2023, AdWare emerged as the most prevalent mobile malware globally, constituting 52.09% of detected mobile malware worldwide. This marked a significant increase from nearly 23% in the previous quarter. Meanwhile, Risktool ranked second with over 11% share, down from approximately 30% in the previous quarter.
20. The global smartphone user base is projected to grow by 1.5 billion users (+30.6%) from 2024 to 2029, reaching a new peak of 6.4 billion users. This trend marks the fifteenth consecutive year of growth, with smartphone users increasing steadily in recent years.
21. Fragmentation remains a significant challenge in the market, with a multitude of devices running various operating system versions and manufacturer modifications. This diversity means that an app's functionality on one device or emulator doesn't guarantee its performance across all devices.
Google has updated the Android version distribution statistics in Android Studio, reflecting data up to October 1, 2023. Here's the change in the percentage of devices running GMS Android since May 30, 2023:
- Android 13: 15% -> 22.4%
- Android 12: 16.3% -> 15.8%
- Android 11: 23.1% -> 21.6%
- Android 10: 17.8% -> 16.1%
- Android 9: 11.9% -> 10.5%
- Android 8.1: 6.1% -> 5.4%
- Android 8: 2.2% -> 1.9%
- Android 7.1: 1.5% -> 1.3%
- Android 7: 1.5% -> 1.3%
- Android 6: 2.3% -> 1.9%
- Android 5.1: 1.5% -> 1.2%
- Android 5: 0.3% -> 0.2%
- Android 4.4: 0.5% -> 0.4%
- Android 13 has experienced a significant leap from 15% to 22.4% of all devices. Following
- Android 13, Android 11 now holds the second highest install base at 21.6%, followed by
- Android 10 at 16.1%, and Android 12 at 15.8%.
Moreover, the percentage of devices running an Android OS version actively supported by Google for security patch backports (i.e., Android 11 and above) has increased to 59.8% from 54.4%.
Why is mobile app testing indispensable?
The primary objective of developing mobile apps is to expand business outreach to a wider audience.
However, users are unlikely to engage with an app that is flawed or difficult to use. Businesses strive to prevent users from uninstalling their apps and turning to competitors. Inadequately tested mobile apps are susceptible to critical bugs that can tarnish the user experience, particularly for new users. First impressions are crucial for app success, as unexpected crashes or functionality issues can prompt immediate app uninstallation, resulting in loss of potential customers and revenue.
How can Global App Testing help?
Global App Testing is a crowdsourcing company that allows you to test your app across 60K real devices, operating systems, and network configurations. With more than 90,000 testers in over 190 countries, we provide valuable insights into real-world user experiences and help identify device-specific issues that may impact usability.
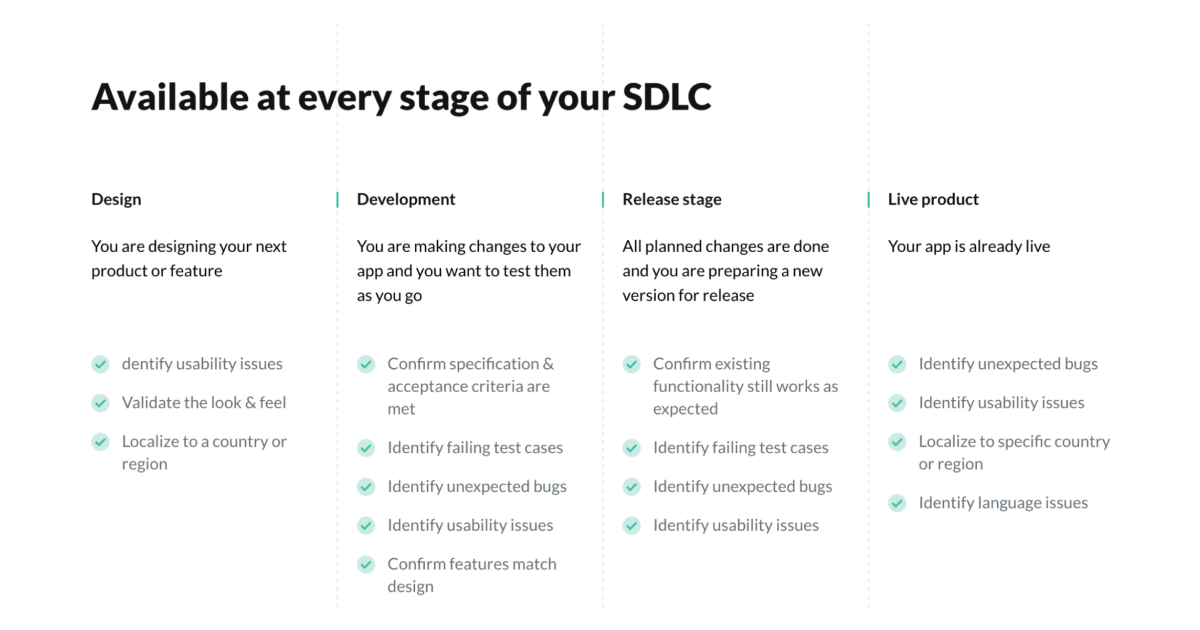
Furthermore, we offer various types of testing, such as:
- Performance Testing to ensure your app performs optimally under various network conditions, including 3G, 4G, and Wi-Fi.
- Implementation of Continuous Integration and Continuous Deployment (CI/CD): You can Integrate mobile app testing into your CI/CD pipeline to automate the build, test, and deployment processes. This allows for rapid feedback loops, early bug detection, and faster time-to-market while ensuring the app's quality and stability.
- Usability Testing with real users to evaluate the app's ease of use, intuitiveness, and overall user experience. Gather feedback through surveys, video logs, and user behavior analysis to identify areas for improvement and refine the app's design and functionality.
At GAT, we prioritize a pragmatic approach by combining a test management platform with widely used bug and issue trackers. This fosters a hybrid testing strategy that harmonizes automated and manual testing efforts, which is crucial for comprehensive and efficient mobile app testing.
Interested to learn more? Partner with us to leverage high-level expertise and resources, enhancing the quality and dependability of your product. Book a consultation with our team today!

