iOS vs. Android: The Bug Wars
Towards the end of last quarter (Q2 2017) we realised that at the heart of our business is a massive and growing dataset. It was like finding a cave that you think could be a goldmine but you need to do a bit of digging first before you can be sure.
What we really wanted to know is what we can learn from the data? So we sent me in to find out.
I can now confirm, it really is a goldmine (more on this later). And while it’s early-stages of our data journey, we thought we’d share the results.
iOS vs. Android
A battle more notorious than Batman vs. Superman. More vicious than East side vs. West side. And more interesting than Coca Cola vs. Pepsi.
This may be extreme oversimplification, but from what I’ve seen, it comes down to one main thing:
Device fragmentation.
A word that incites fear in the hearts of people all over the world. Or maybe just QAs and devs all over the app world. But the fear is still there.
When you really think about it, the things Android phones can do is a rapidly growing list, everything from bizarre to practical. Thermal imaging. Compact phones. Rotating cameras. Dual SIM phones. Edge screens. And creating a single app that works seamlessly with all of the unique hardware and software features is basically impossible.
So really, I’m already expecting the data to tell me that Android is buggier than iOS. And that there are more test requests for Android to deal with this additional inevitable bugginess.
But that’s enough speculation. Let’s see what the numbers have to say.
General Stats
Across all of our exploratory cycles requested last quarter, 36.7% were Android and 35.5% iOS. However, 39.8% of our bugs come from Android cycles, while only 31.5% come from iOS.
77% of customers who tested both iOS and Android apps received more bugs on Android. With their Android apps being on average 24.7% buggier than the iOS equivalent.
Every app can be broken down into main features or components. And each bug that is reported is categorised into one of these components.
Components like Registration, Feed and Settings.
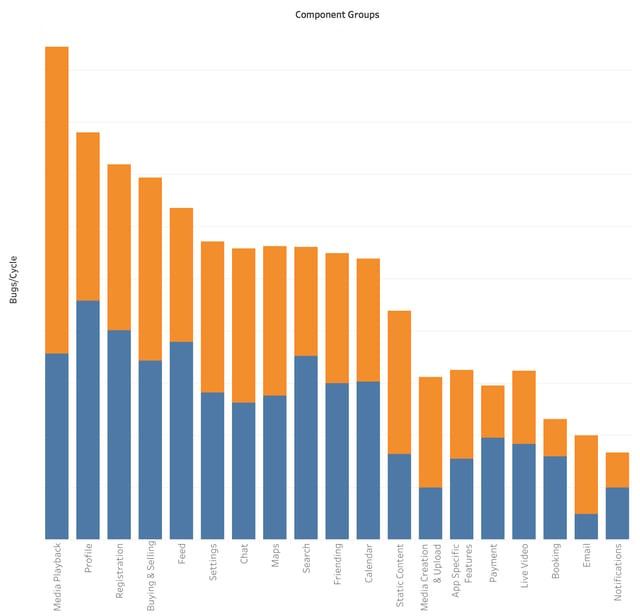
When we dig deeper and start looking at the individual features of the apps, things get a little more interesting. Here’s a sample of the component data (Orange - iOS; Blue - Android):

65% of components were buggier for Android than they are for iOS. Including Profiles, Search and Payment. And these components received, on average, 31.5% more bugs than iOS apps.
For the 35% of components that had more bugs on iOS, they received 12% more bugs. This includes Media Playback, Chat and Media Creation & Uploading.
Media
Across all the components, I’ve found these to be the most interesting. There were far more bugs reported for iOS apps than Android. 64.8% more for Media Playback and 111.8% more for Media Creation & Uploading. So this is really saying that last quarter iOS did not handle Media well.
I spend an embarrassing amount of time on my phone looking at videos of animals doing ridiculous things. I haven’t used a CD player in over 7 years, Spotify is the one for me. And since I discovered the joys of Instagram a year ago and I never looked back.
I know I’m not the only one. And I know it’s not just a millennial thing.
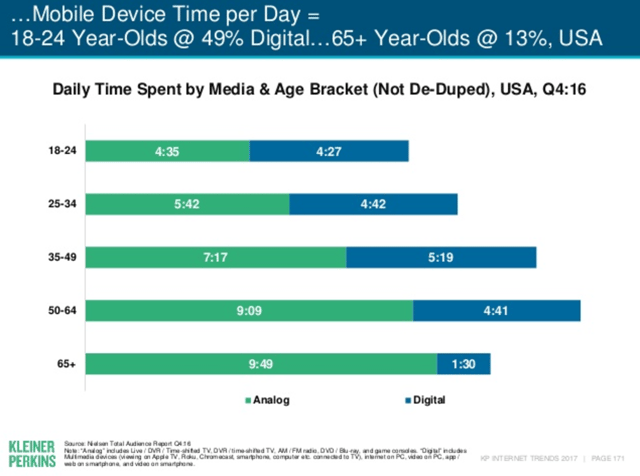
According to a study by Mary Meeker and Kleiner Perkins, Americans between 18 and 64 years spend, on average, 4 hrs 47 mins per day on digital media.

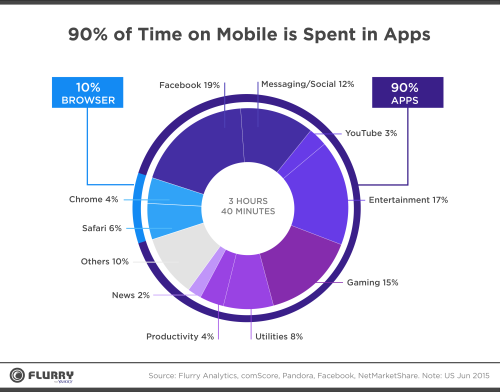
Adding to that is the fact that according to a study by Flurry, 90% of the time spent on mobile devices is on non-mobile-web applications.

Which is why, it really is so shocking we’re seeing these sorts of numbers. That consistently iOS received more bugs than Android and particularly in Media Playback. What could be the reason? I haven’t got to the bottom of this yet. But reader, I’ll let know if I do.
So what should you learn from this?
As we set off on this adventure, we realised that we’d been sitting on this goldmine of data. And after some panning, sluicing and dredging, our goldmine gave us real data-backed insights that we use to advise on testing strategies and direct our exploratory cycles.
Looking at the graph of No. Bugs vs Components above, the first thing to do is identify which of those components your app has and where you should be spending a bit more time.
You know my thoughts on Media components in iOS. But a few others to look at are Profiles on both apps, and Android in particular. And integrations like chat, maps and calendars.
Pages with static content, including things like help centers and menus brought in a surprisingly high number of bugs across both platforms. This really highlights the importance of regression and the idea that even though a specific feature hasn’t changed, changing other features could indirectly cause bugs.
Almost every app has app-specific components. In the B2C world it’s often in the features for its users, think of Tinder and their nifty swiping feature. Maybe it’s behind the scenes like Jukedeck and their backend algorithms using AI to create music. It’s their USP. Why users choose to use them. And, if your app doesn’t have one, no amount of QA can help you here.
When I started this project I expected that the completely new and unique features and products to be the problem children of QA. Once again the data has proved me wrong. In fact, the App Specific Features bring at least 9.3% less bugs per cycle than common features like registration, media creation and even settings.
Which when you really think about it, makes sense. If you’re developing your app, to do this new and amazing, never-been-seen-before thing, you’re going to make sure that it works perfectly.
That one feature is tested over and over by the devs before it even makes it into QA. Before it even makes it into a crowd-sourced exploratory testing cycle.
The reason there are any bugs at all is because of a few different reasons. Because of device/OS fragmentation - I feel like I’m starting to sound like a broken record on this one. Because new perspectives bring new use cases. Because of user environments that can’t be mimicked in an office.
And because our testers are that good.
But the main learning point here, is that while you will unit test and retest and retest your unique app features, don’t ignore the common functions of the app world. The profiles. The email integrations. And the search functions.
So what did we learn from this?
While it’s great to have these numbers to throw into our blog posts and to create fancy graphs and charts. Our real aim is to figure out how we can use this data in our testing to make sure we’re focusing where we should be.
And as a side effect, we found out a thing of two about our processes, our bugs and our testers.
About the timeline of a cycle
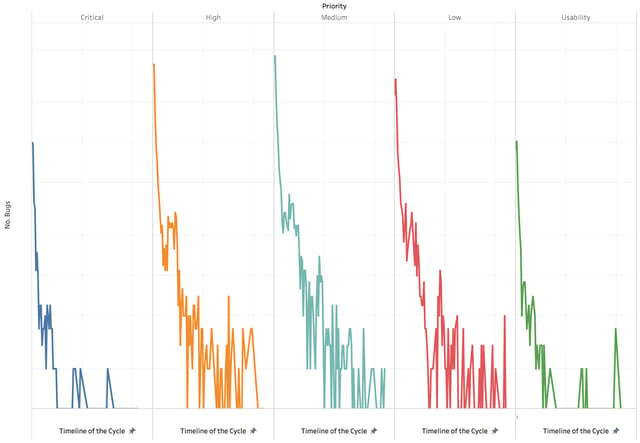
We give our testers 48 hours to test (excluding weekends). And looking at when the bugs are submitted over the timeline of a cycle, we found that velocity slows over time.

But what was really interesting is that for the Critical and Usability bugs, the majority of them were found in the first 24 hours. Meaning that it’s likely the low-hanging bugs and core-flow crashes that are found quickly, while the mid-range meaty bugs keep coming in over the entire cycle.
About our own systems
This was the first time we’ve truly dug deep to analyse the data. And we learnt a lot about how we can change things to make it easier for next time.
We need standardised ways for testers to enter device data. No one wants to manually sift through tens of thousands of bug reports looking at the devices. Standardising the Samsung Galaxy S3s and the Samsung S3s and the Galaxy S3s (don’t forget the Samsung Galaxy S III). Which it why, you’ll notice, we don’t yet have any numbers on anything device-specific.
We need to rethink the way we categorise our bugs. While we’ve learnt a lot from the data on which components have the most bugs. A lot of that categorisation was manual. By me.
Login vs. Sign in vs. Register vs. Signup & Login vs. Onboarding vs. Login/Logout. It was the opposite of fun.
And aside from my manual data cleanup woes, it has also highlighted another area where standardisation could help us on our path to being data champions.
About where we test
The last key learning was about the many countries and languages that were involved in our tests. 34% of our tests were localised across 27 countries and 5 continents.
Across all of our cycles - global and localised, we had testers from 82 countries. Bringing new perspectives and unique experiences to our testing community every day.
It’s been a wild adventure where the story has unfolded the deeper down the mine I went. Subscribe to the blog to stay tuned for the next installation of Bug Wars.

